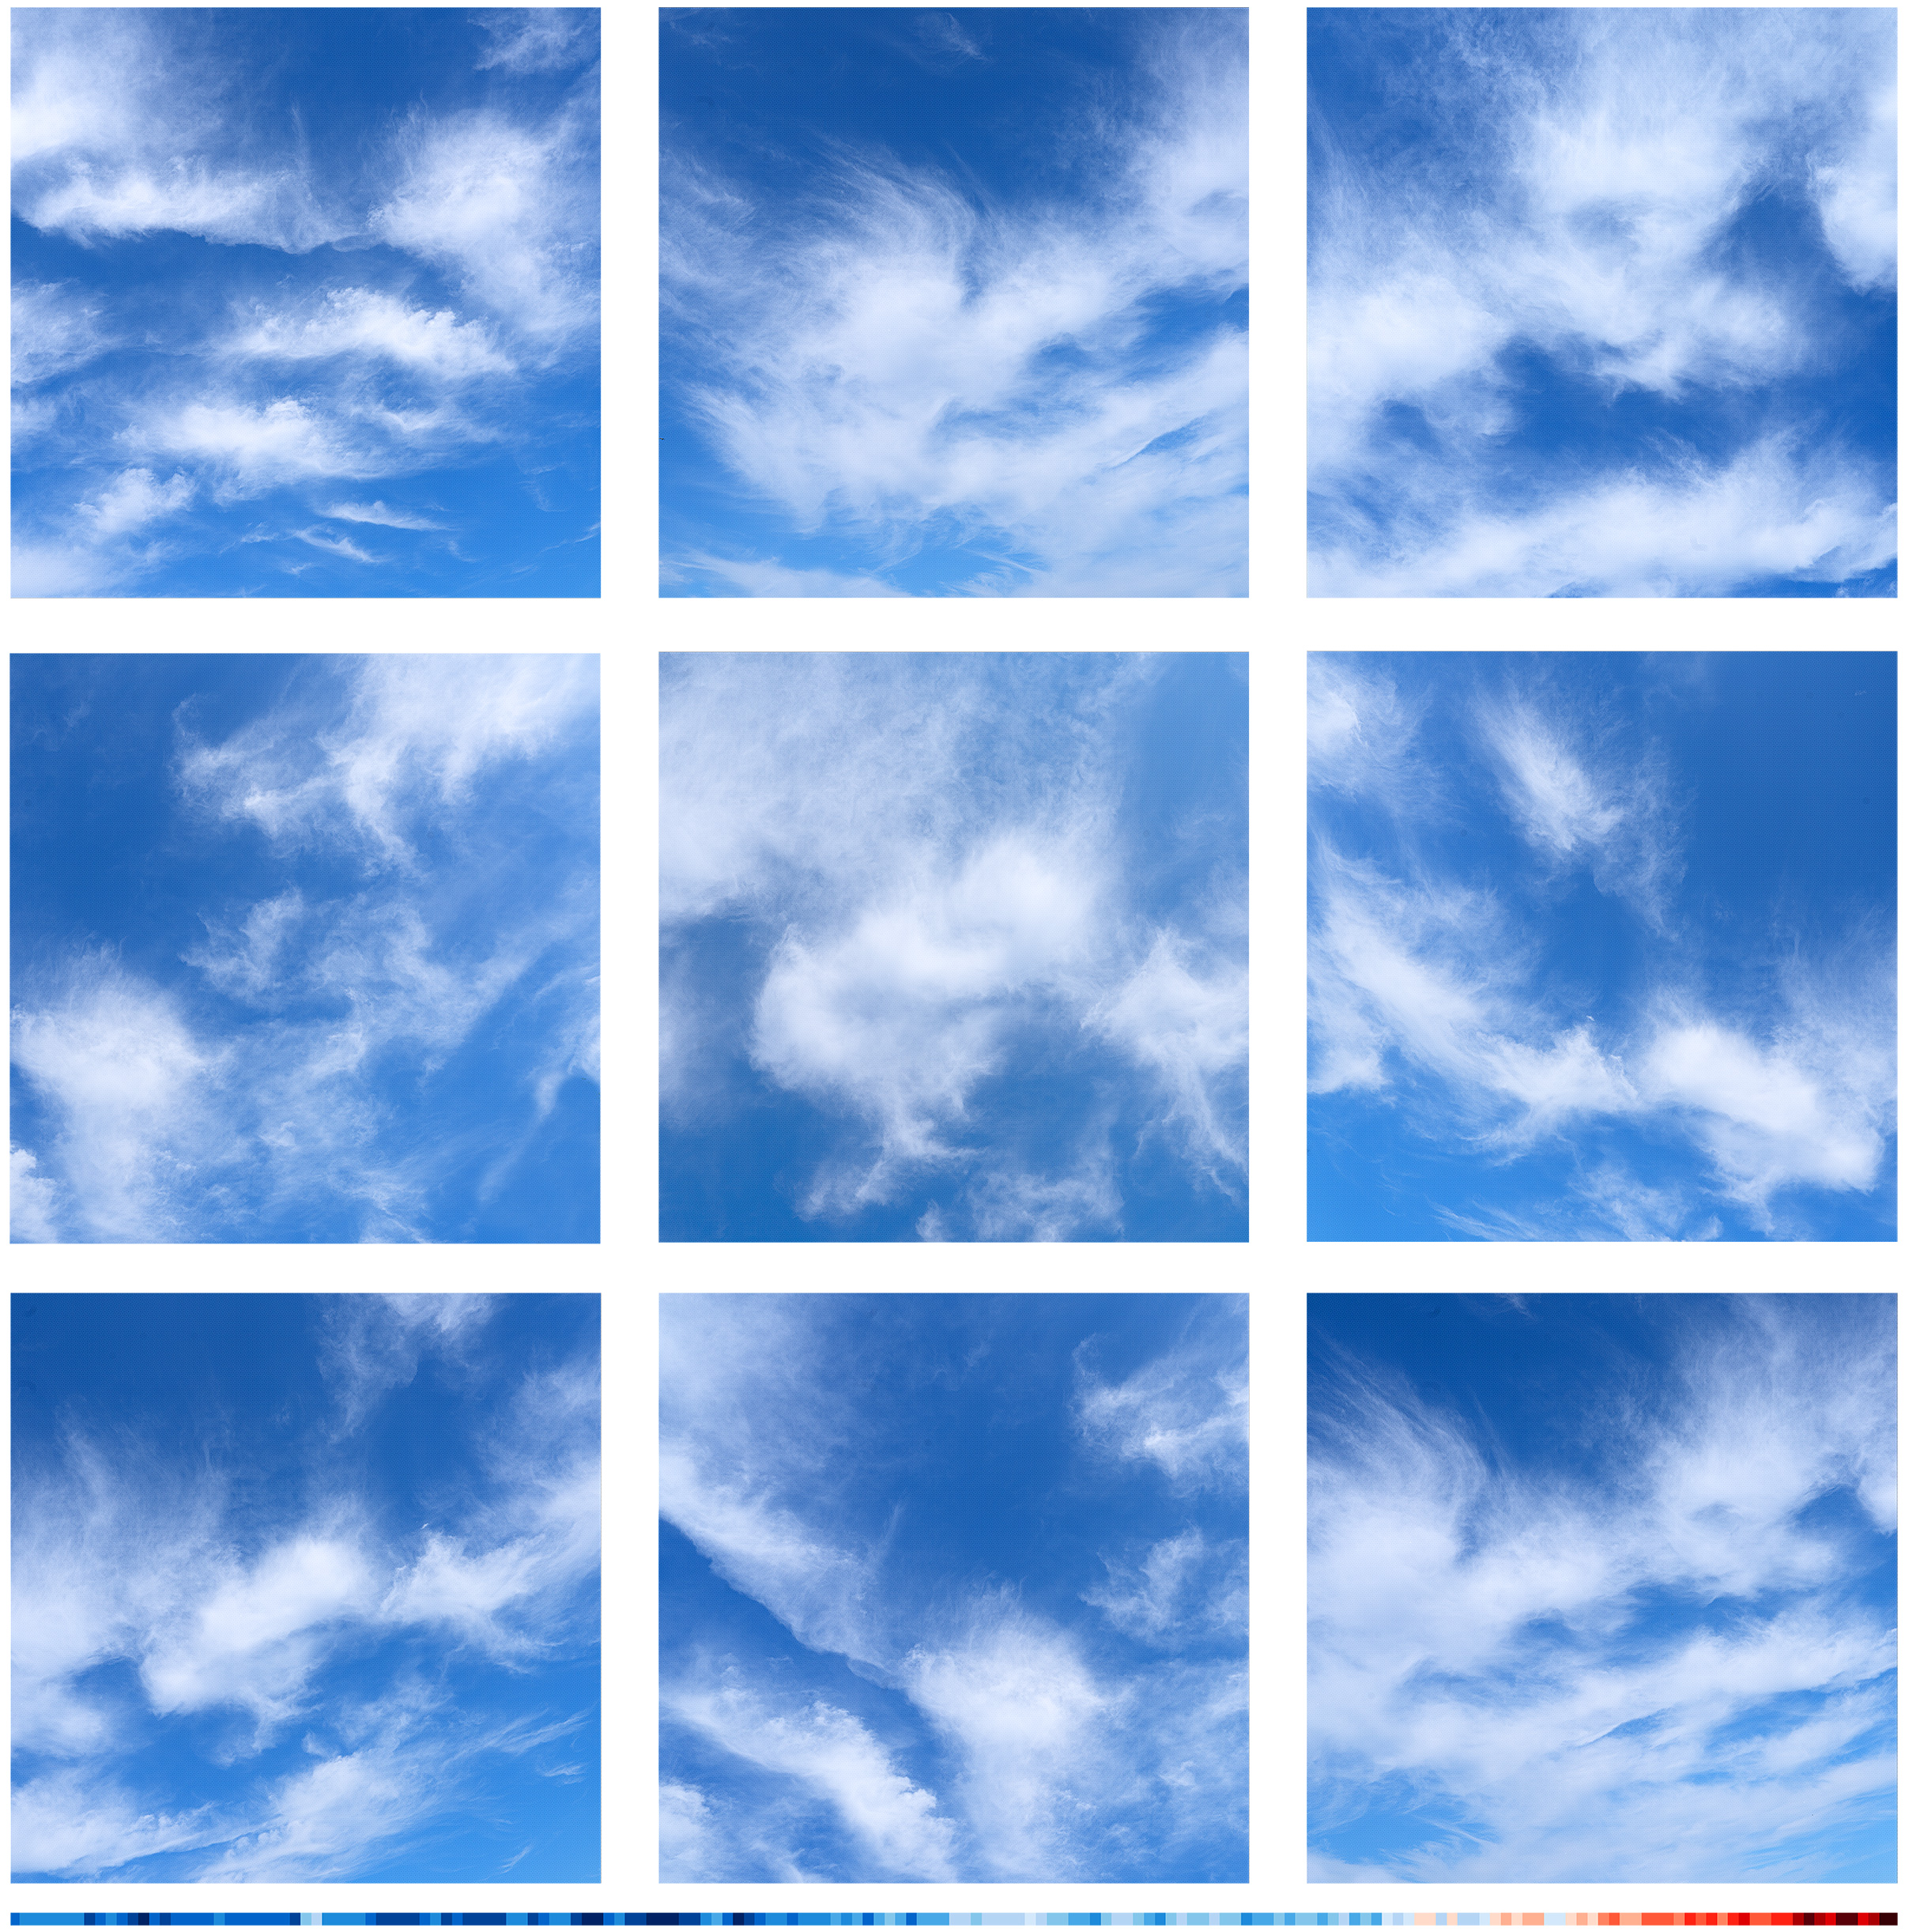
The image above is inspired by the blue to red graphic strip at the bottom of the image illustrating global warming from 1961 to 2010 with each stripe representing the average yearly temperature. The graphic was created by Professor Ed Hawkins at the University of Reading in England and has been used widely with over 1 million downloads within a week of release in 2019.
The grid of clouds also illustrates the amorphous nature of greenhouse gasses – as our atmosphere may look the same as in years past, the chemical composition of the atmosphere is dramatically different with potentially dire consequences.
Another inspiration for this image is Alfred Stieglitz’s photographs of clouds taken in the 1920s, what he called equivalents i.e. the clouds were metaphors or equivalents for his emotional and spiritual state. I first saw his cloud photos when quite young and I’ve photographed clouds ever since.
Clouds have taken on new meaning and symbolism related to climate change as well as a symbol widely used since the 1970s to illustrate IT connectivity. I wonder what Stieglitz would think of clouds now, how would they move him spiritually and emotionally 100 years later?
See more about bio stripes.