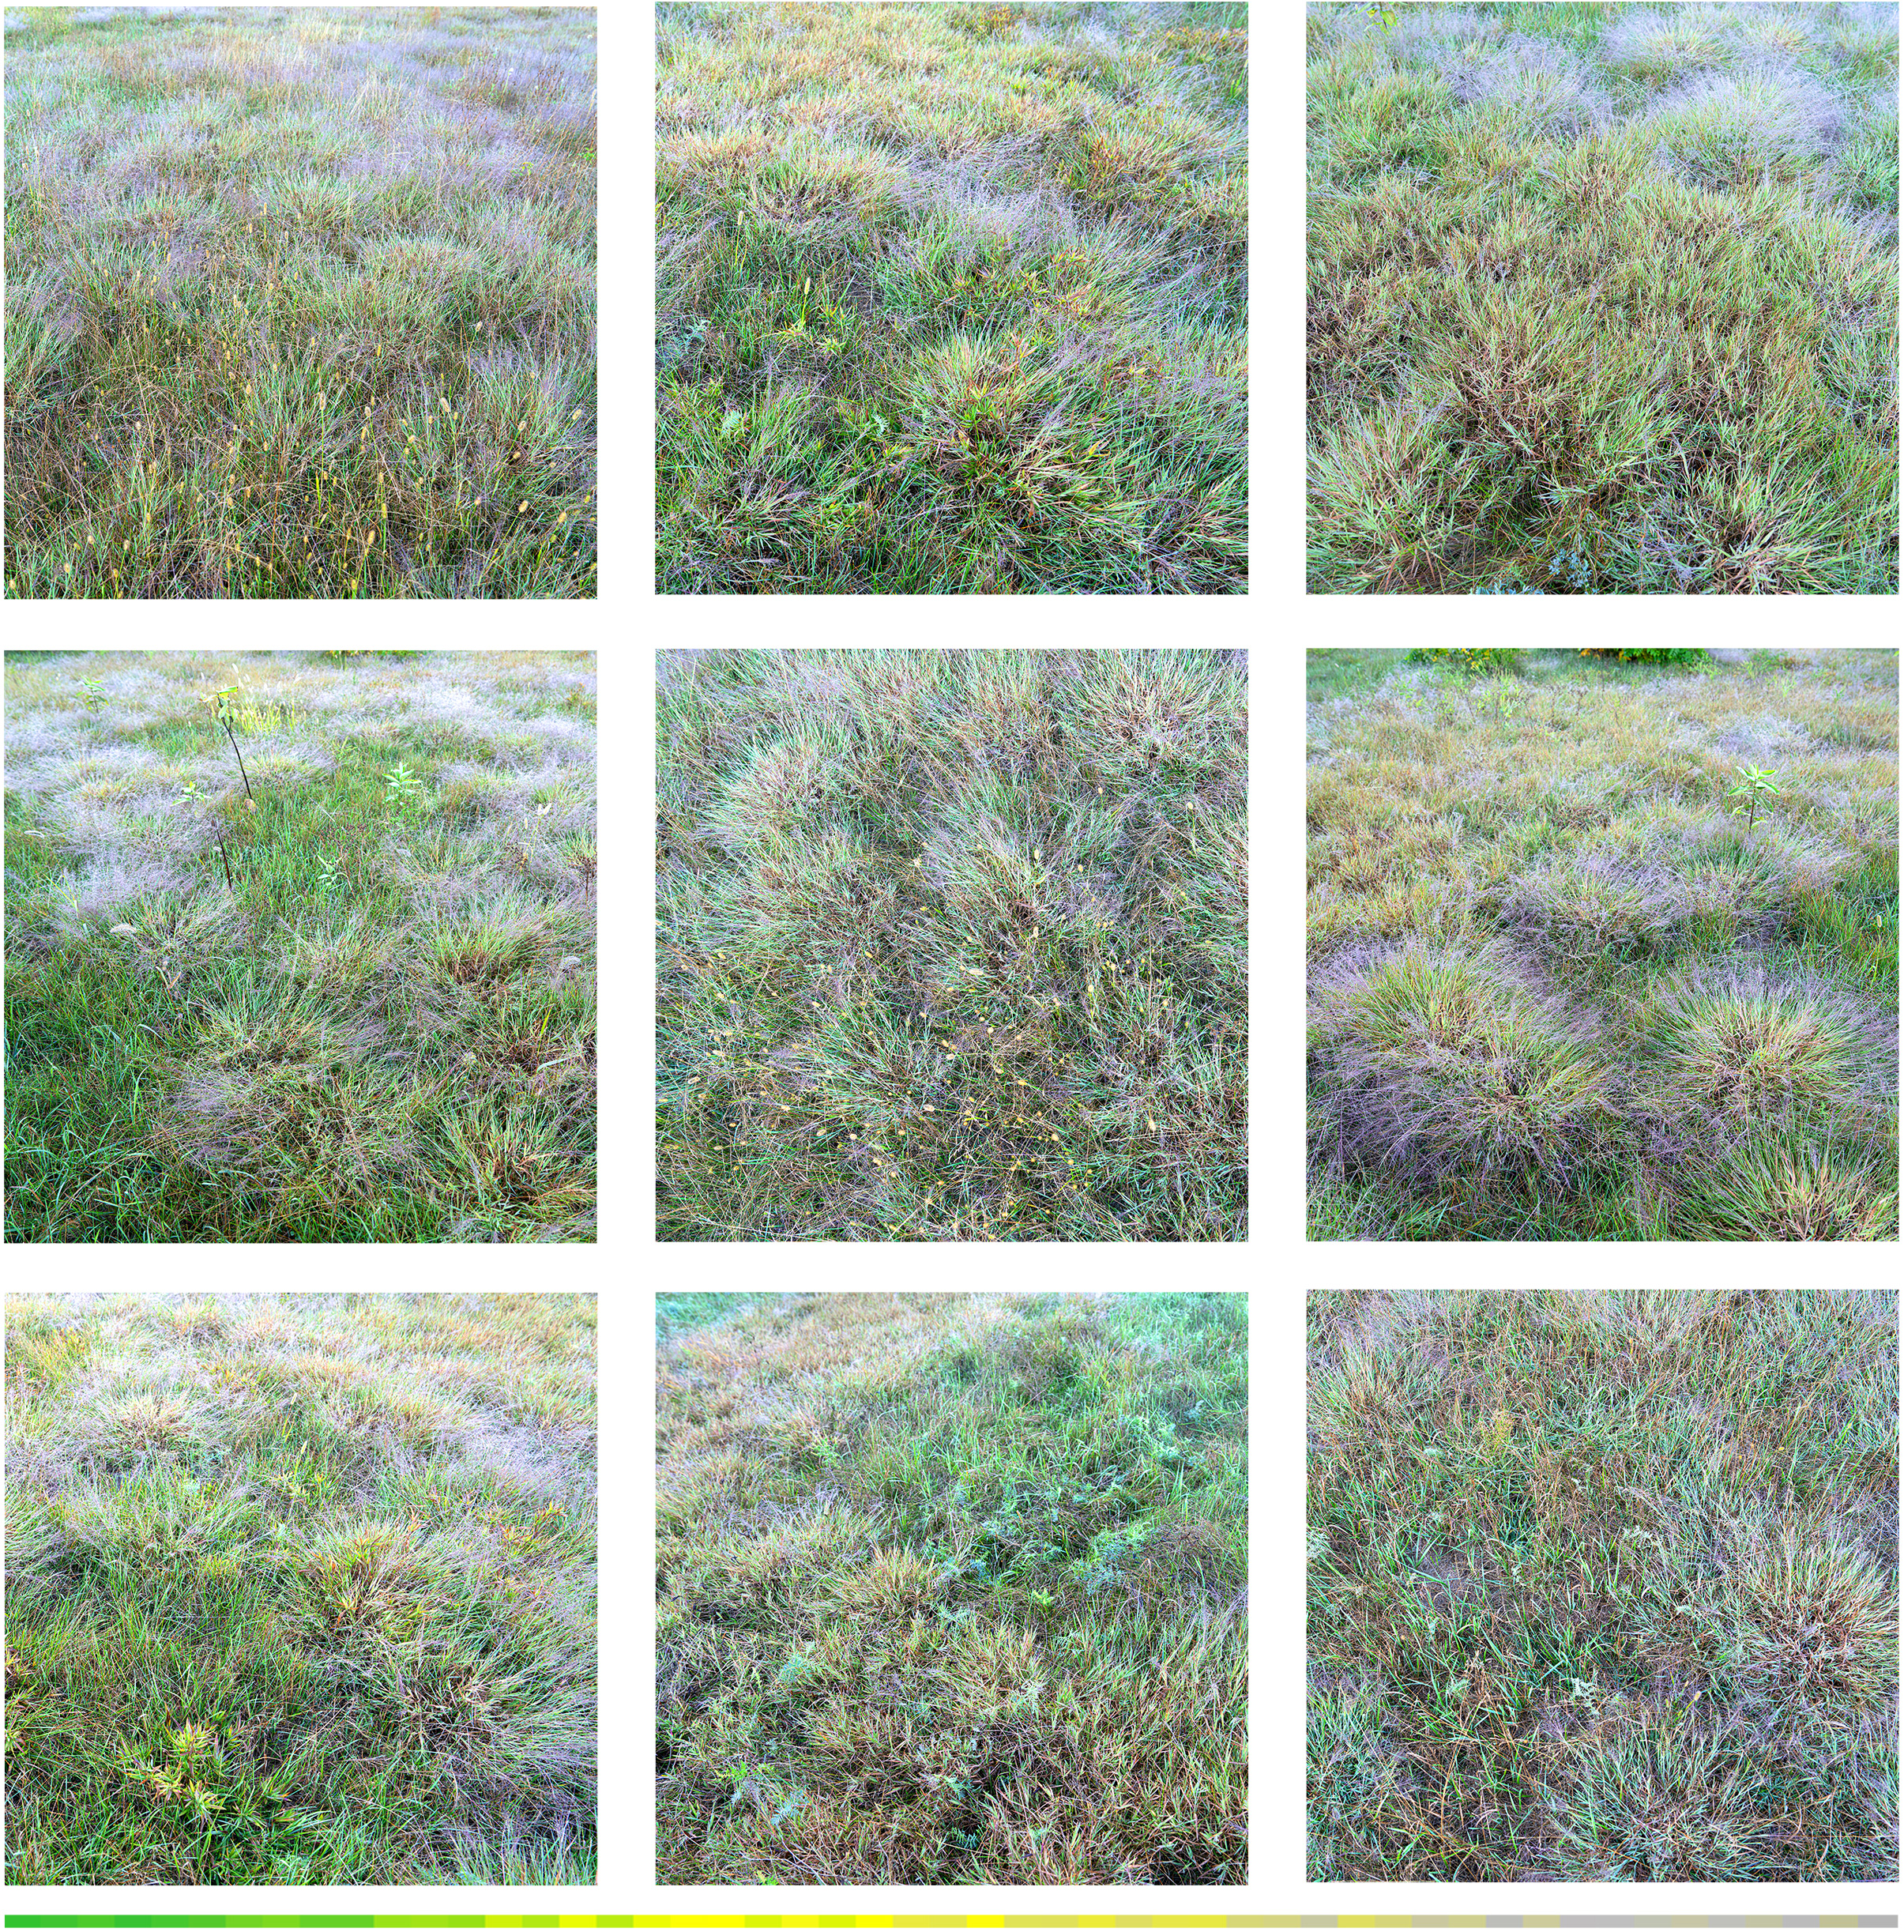
The image above was created after seeing the Biodiversity Stripe i.e. the green-to-grey graphic at the bottom illustrating biodiversity loss from 1970 to 2020. The stripe was created by Miles Richardson and illustrates a 73% overall population decrease in wildlife species globally (Living Planet Index, 2024).
The 9-way grid image is of a field in Concord, Massachusetts, photographed in the fall after a light frost had melted away. The field is in a suburban-rural area and is mowed every year or two to keep trees from growing.
Even a field like this hosts hundreds of flora and fauna species such as perennial grasses (bluestem, big bluestem, switchgrass), wildflowers, goldenrods, milkweeds, tree seedlings (white pine, red maple), shrubs (gray dogwood), bumblebees, sweat bees, flower flies, grasshoppers, crickets, leafhoppers, ambush spiders, swallows, eastern bluebirds, red-tailed hawks, American kestrels, meadow voles, star-nosed moles, short-tailed shrews, white-tailed deer, eastern cottontail rabbits, red foxes, coyotes, garter snakes, milksnakes and toads to name a few.
Conversely it’s alarming to see that wildlife populations have declined dramatically over the past 50 years and the rate of decline is increasing. The consensus among evolutionary biologists is that the sixth mass extinction is already happening and there’s little evidence that it will stop.
For me this is the most alarming aspect of the Anthropocene. How human impact is responsible for massive die offs of wildlife populations and ultimately the extinction of species and what that means for humans, plants, animals and the planet. Learn more about Miles Richardson and the state of biological diversity at the Living Planet Index.